Tutorial: Managing Logs with the ELK Stack
Consolidating, indexing and analyzing your environment’s logs is fundamental. Gone are the days when truckloads of logs were stored only to be used when something went wrong. It’s possible to extract a lot of information from your infrastructure and applications’ logs, allowing you to rapidly detect abnormalities, foresee problems and even support business decisions.
There are plenty of cloud log management services around: Loggly, Papertrail e Logentries are some of the most used. Their goal is to be as simple as it gets: create an account, redirect your logs to the provided endpoint and that’s it: the rest is on their side. I’ve used these three and I might write about them some day, but we have another objective in this post: I’ll show how you can create a flexible and powerful log manager using the Elasticsearch/Logstash/Kibana stack.
ELK?

All three components of the ELK stack are open source (Apache 2 license) and kept by Elastic, allowing modification, distribution and commercial use. The components are:
Elasticsearch: distributed search engine based on Apache Lucene. It has a RESTful API as interface, with JSON objects.
Logstash: data pipeline tool. Centralizes, normalizes and processes data from different sources.
Kibana: data visualization web interface. Allows creating graphs and filters for data indexed by Elasticsearch.
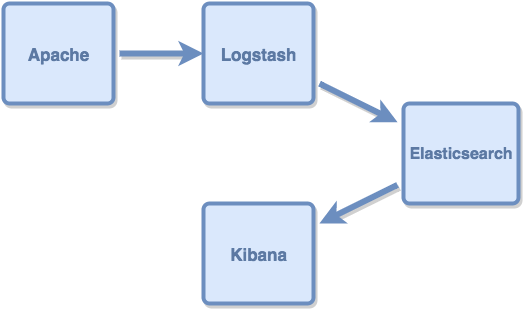
This is the data flow throughout the stack: data is generated and sent to Logstash. Logstash reads, parses and filters the data, then sends it to Elasticsearch. Kibana uses Elasticsearch’s indexes to search data and displays it in a user-friendly way.
In this example, we’ll use an Apache log as input. The flow is as follows:
Installation
I’ve used Centos 7 for this tutorial. The commands should work in any RHEL-based distro.
Java
Logstash runs both on Oracle JDK and OpenJDK. We’ll use OpenJDK:
sudo yum install java-1.8.0-openjdk.x86_64
The stack installation process is pretty straightforward: simply download the components and decompress the files. I’ll put them all in the /opt/ folder. I’m using the most recent versions (at the time of writing).
Elasticsearch
curl -O https://download.elastic.co/elasticsearch/elasticsearch/elasticsearch-1.7.1.tar.gz
sudo tar -xzvf elasticsearch-1.7.1.tar.gz -C /opt/
Logstash
curl -O https://download.elastic.co/logstash/logstash/logstash-1.5.3.tar.gz
sudo tar -xzvf logstash-1.5.3.tar.gz -C /opt/
Kibana
curl -O https://download.elastic.co/kibana/kibana/kibana-4.1.1-linux-x64.tar.gz
sudo tar -xzvf kibana-4.1.1-linux-x64.tar.gz -C /opt/
Creating the Logstash pipeline
To create a Logstash data pipeline, we need to specify the inputs, filters and outputs. The inputs and outputs read and write data, while the filters adapt the data format to what the output expects. Logstash’s architecture allows installing inputs, filters and outputs as plugins, as well as creating your own.
Let’s create a pipeline with a an Apache access log as input and Elasticsearch as output. The scenario is as follows:
input: reads a file containing Apache access log
filter: parses each log line in a JSON object to be used as input in Elasticsearch
output: sends the JSON objects to an Elasticsearch instance
We’ll use the Grok filter to transform text from the log file into structured data. Grok allows parsing input text using patterns. It ships with a number of different patterns, Apache being one of them.
The file input transforms each line of the log file in an event. The Grok filter reads the events, finds the fields matching the pattern (ip, request type, response etc.) and adds them to the event. The Elasticsearch output gets the events, transforms them into JSON objects and sends it to an Elasticsearch instance.
This is the configuration file for the pipeline: [gist 4e0c4561471f8a00f428]
Change /path/to/apache_log to (guess what …) the path where apache log is in your machine and save it. If you don’t have an Apache log to test, use this one. Decompress it with tar -xzvf access_log.tgz
You might have noticed that, contrary to what one could expect, the elasticsearch output does not specify the Elasticsearch instance’s address. Since Elasticsearch is running in the same machine as Logstash and is configured with Multicast enabled by default, it will be automatically found. This configuration is not recommended for production environments.
Running
Let’s start by initializing Elasticsearch:
<elasticsearch_root_folder>/bin/elasticsearch -d
Now Logstash:
<logstash_root_folder>/bin/logstash -f pipeline.conf &
And now Kibana. Notice that we didn’t edit any configuration files for Kibana: by default, it will look for an Elasticsearch instance in localhost:9200 (which is exactly where our elasticsearch is).
<kibana_root_folder>/bin/kibana &
Now browse to the port 5601 of your machine. You should see something like this:
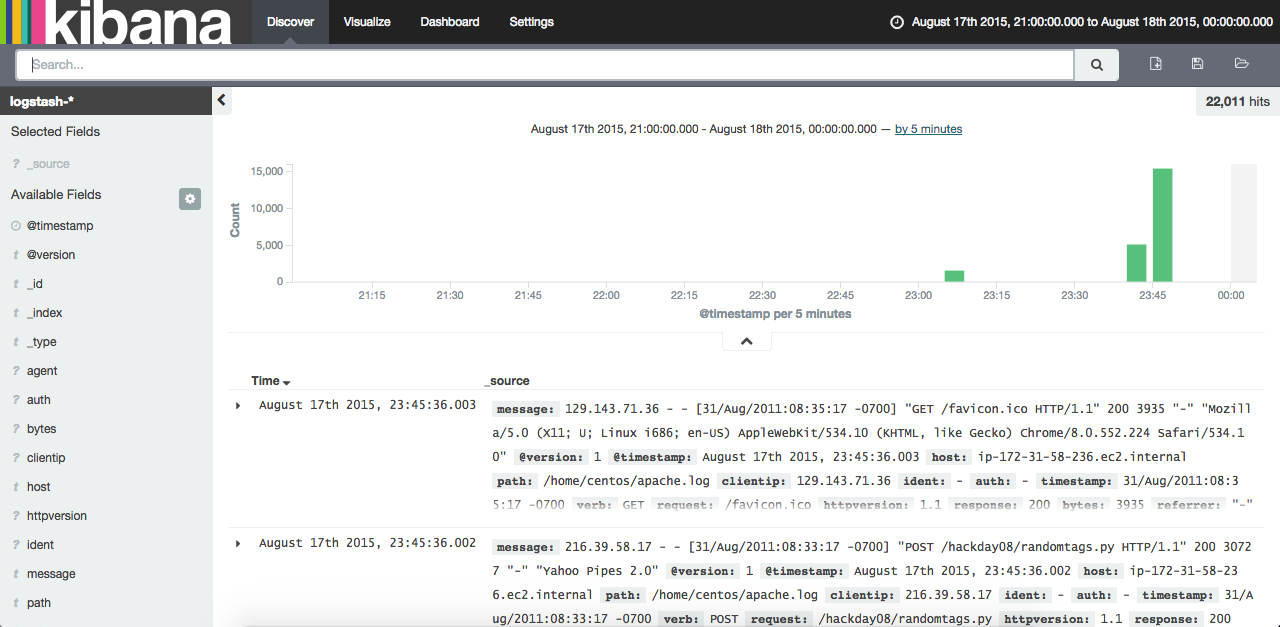
There you go! You have an open source, flexible and scalable log management system. You can read a little more about Kibana usage in this post.
[yasr_visitor_votes size=”small”]